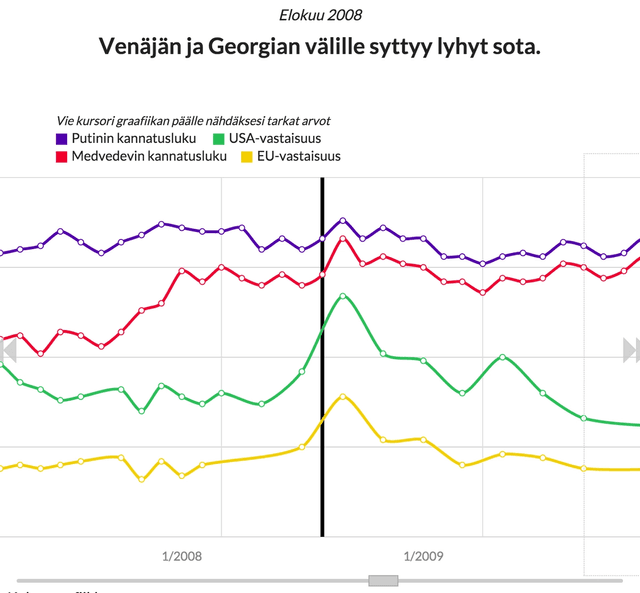
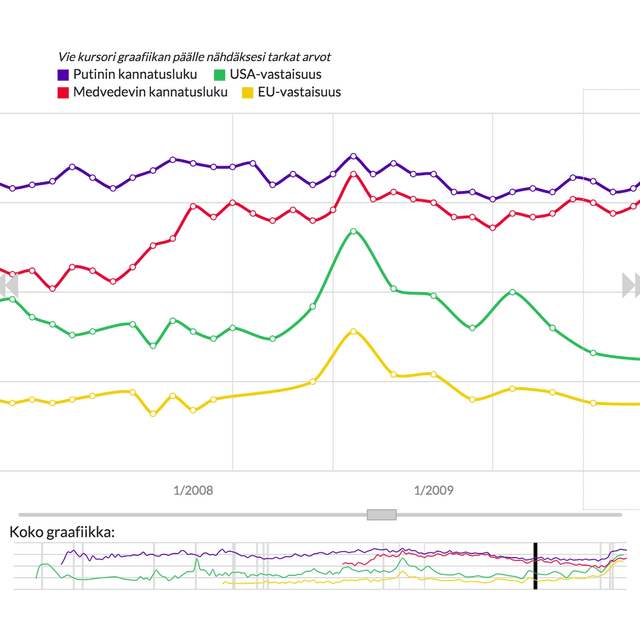
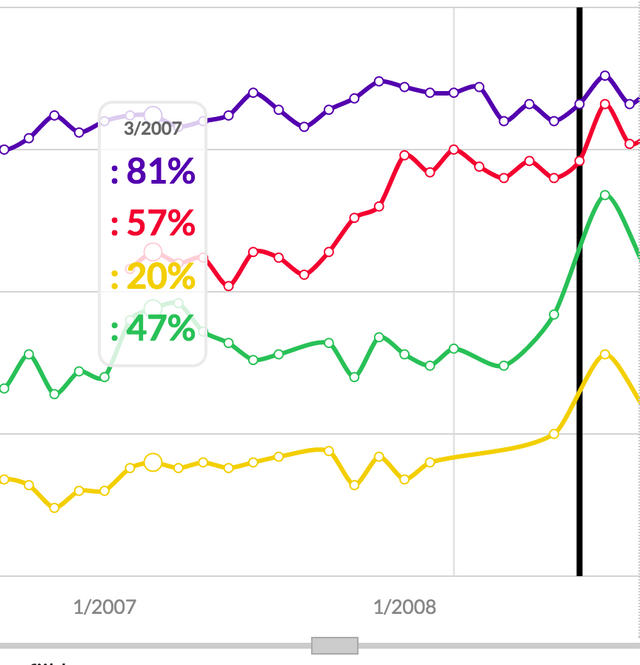
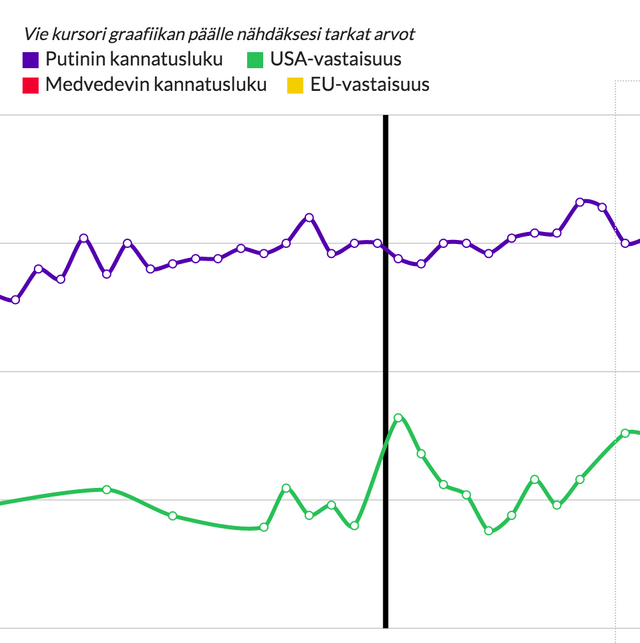
Approval rates
A customized timeline graph for displaying graphable, quantitative data in juxtaposition with qualitative, textual data to explain the reactions of the graph.
This particular graph illustrates the approval ratings of Russian leaders, approval rates of EU and US in Russia as well as showing key points in the Russian political sphere. The idea was not to present any particular hypotheses or conclusions, but to explore the given datasets by juxtaposing them with events that might affect them, leaving interpretation to the user while giving them all the information possible.