Diabetes
A common type of map-based visualization designed, developed and published as a part of the news production of the finnish news agency STT. This is only one example of a design that saw frequent use with multiple variations and themes.
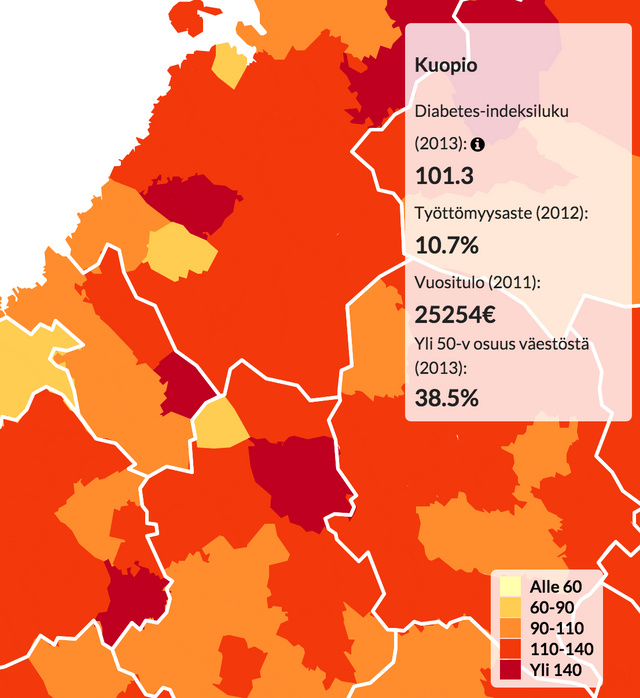
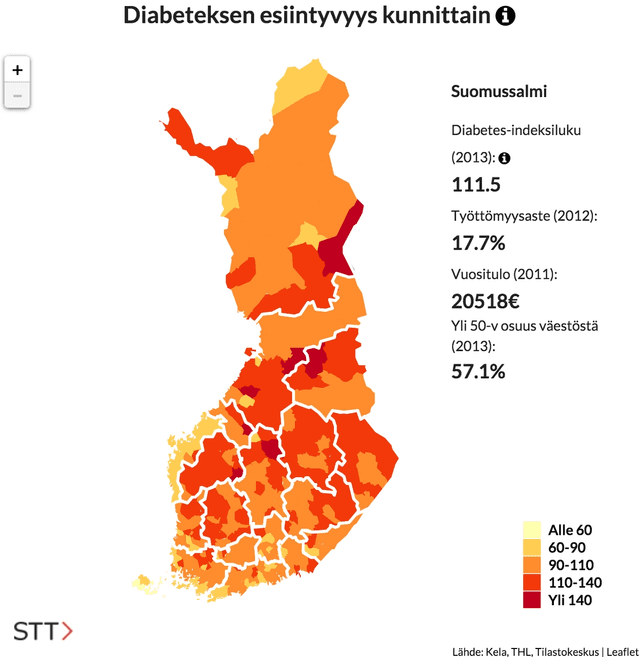
Working together with a writing journalist, the incidence of diabetes in Finland was explored. The process included collecting data from different official sources and combining these to create the base dataset for the story.
The end result included this Leaflet-based interactive choropleth map of the incidence number in all Finnish municipalities, juxtaposed with potentially interesting underlying data.
Tech: Leaflet.js, ArcGIS