Election day results
As part of the news package produced for the parliamentary elections of early 2015 in Finland, we at STT produced a set of real-time visualizations of the election result data. Working together in a team of a graphic designer, visual journalist, back-end developer and various journalistic personnel, I was responsible for the development, concept and user experience of the front-end displaying this data – the result being these four visualizations.
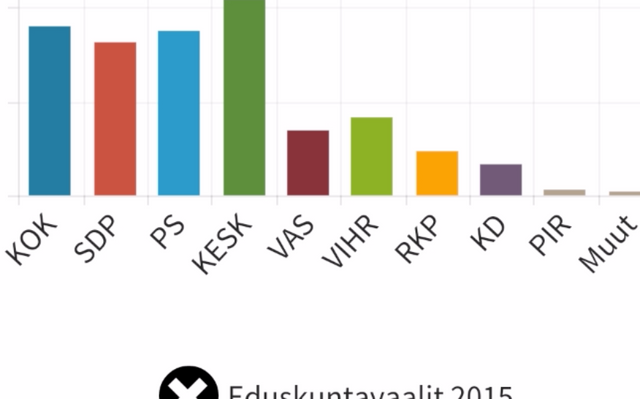
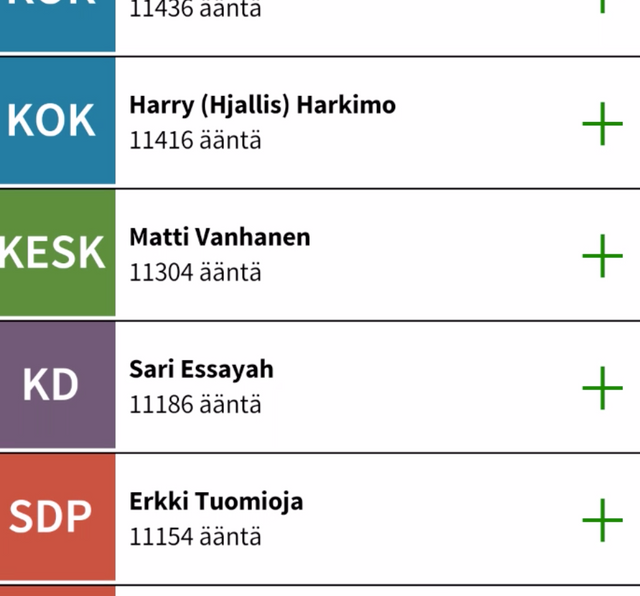
We were tasked to design deveral different views into the data, and deliver these as a package to STT clients. A modular approach was taken – in order for the customers to get the most out of these graphics, they were produced as separate views: The new parliament, the vote distribution of parties, those who did not get re-elected and all those who received votes. This allowed the customers to build their own results pages by embedding our live graphics to custom pages in their web publications – which turned out very popular during election night, closing in on 300 000 users in total across all of our clients' publications during the election night.
Tech: Azure, jQuery, chart.js